of the North American Free Trade Agreement
|
|
of the North American Free Trade Agreement |
This Chapter assesses the effect of NAFTA on sectoral trade. It is divided into two sections. The first section discusses common patterns that emerge across sectors. The second section examines 11 key industrial sectors, as well as the agricultural commodities sector, addressing for each tariff and non-tariff changes effected by NAFTA, trade flows since 1993, and investment, employment, and production patterns in U.S. trade with Mexico. 31 The analysis isolates the effects of NAFTA in each sector, to the extent possible. 32
Common Patterns
| As indicated in Chapter 1, isolating the effects of NAFTA from other factors impacting trade during 1994-96 -- NAFTA's first three years -- is challenging on an aggregate basis. That challenge is greatly increased at the sectoral level because of data inadequacies and sector-specific factors. Nonetheless, the overall effect of NAFTA on aggregate trade flows is apparent across the range of individual sectors. For example, sectoral trade flows were often affected by Mexican tariff reductions during the period, which were typically much larger than the corresponding U.S. tariff reductions, largely because U.S. tariffs were initially so much lower. Moreover, bilateral trade expanded rapidly over the past three years with Mexico increasing its share of U.S. imports and the United States gaining an even greater share of Mexican imports. |

|
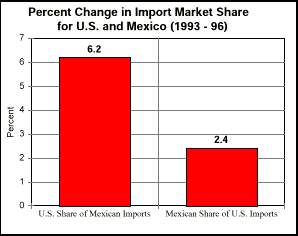
From 1993 to 1996, Mexican imports from the United States rose 48.5 percent (in U.S. dollars), despite the 50 percent depreciation of the peso and Mexican recession, according to official Mexican import statistics. Mexican imports from all other suppliers rose by only 10.1 percent, resulting in a 6.2 percentage point market share gain for U.S. products. By 1996, U.S. exports had captured a nearly 76 percent share of Mexico's total import market. (Figure 1.)
Over this same period, U.S. Government data show that imports from Mexico, accelerated by strong U.S. demand, grew by 86.1 percent. Imports from all other sources grew by 33.3 percent, raising Mexico's share of U.S. imports by 2.4 percentage points to 9.3 percent of the U.S. import market. (Figure 2.)
| While absolute changes in exports and imports at the sector level were noteworthy, they often reflected a range of factors other than NAFTA. On the U.S. export side, a more revealing indicator of NAFTA's effect was the change in the share of the Mexican import market commanded by U.S. products in particular sectors. An examination of changes in Mexican import market share can isolate NAFTA from other factors. Unlike other factors -- such as changes in Mexican demand -- that affected all foreign suppliers equally and thus should not have significantly altered import market share, the reduction in Mexico's tariff and non-tariff barriers under NAFTA solely applied to U.S. (and Canadian) products. Those reductions therefore can be expected to have had a differential effect on relative market shares. The greater the reductions in Mexican tariff and non-tariff barriers the greater the impact on relative market share is likely to be. |
|
With respect to U.S. imports, however, changes in market share were less indicative of NAFTA's effects in most sectors, because the United States had few significant import barriers prior to NAFTA. The effects of the Mexican peso devaluation overwhelmed the impact of modest U.S. tariff decreases in most sectors by lowering the price of Mexican products in the U.S. market. 33
The mutual U.S. and Mexican increases in market share also reflect in part cross-border production synergies that were enhanced through NAFTA. By removing trade and investment barriers in North America, NAFTA has begun to make all three countries more competitive relative to third-country suppliers. Evidence from a range of key sectors illustrates this point. Moreover, U.S. imports from Mexico are by many instances displacing imports from Asia and elsewhere.
Tariff Reductions
NAFTA has begun to rectify the tariff disparity between Mexico and the United States that existed prior to 1994. Mexico has made far deeper cuts in its average tariff rates across the range of sectors. A summary comparison of tariff reductions across 22 broad sectors accounting for all U.S. bilateral goods trade with Mexico is shown
in Table 1. 34
The table illustrates that in each of the 22 sectors, except vegetable products, Mexican import tariff reductions were greater than U.S. import tariff reductions. For example, there was a ten-fold differential in the size of the Mexican and U.S. tariff decreases from 1993 to 1996 for chemicals, a nine-fold differential in tariff
decreases for transportation equipment; and a four-fold differential for electronic goods and appliances.
For further comparison, the following graph compares Mexican and U.S. tariff reductions for the sectors experiencing the greatest increase in U.S. trade with Mexico for the period 1993-1996.
35
(Figure 3.) The broad sectors included in this graph account for approximately 90 percent of total U.S.-Mexico trade.
U.S. Exports to Mexico
An analysis of import market shares in the 12 sectors examined later in this Chapter reveals that the United States is by far Mexico's biggest supplier, and has increased its dominance in the Mexican import market in nine of those sectors over the past three years. In absolute terms, U.S. exports to Mexico also increased in nine of
the 12 sectors over the three years following NAFTA's inception, in some cases by substantial margins. This growth occurred despite the peso devaluation and
Mexico's recession. For example, over the period 1993-1996, U.S. exports of automotive products increased by 11 percent (including a more than five-fold increase in motor vehicle exports), chemicals exports were up by 50 percent, computers by 58 percent, textiles and apparel by 79 percent, and electronic components by 157
percent.
U.S. exports to Mexico in the 12 sectors generally followed common patterns after 1993:
U.S. Share of Mexico's Import Market
While these absolute export increases are noteworthy, on a sectoral level, they are not necessarily indicative of a NAFTA effect. A better indicator is the change
in the share of Mexico's import market captured by U.S. products from 1993 to 1996.
As noted earlier, such changes tend to isolate NAFTA effects, because all exports competing in the Mexican market experience aggregate effects, such as the
Mexican recession, equally. 38
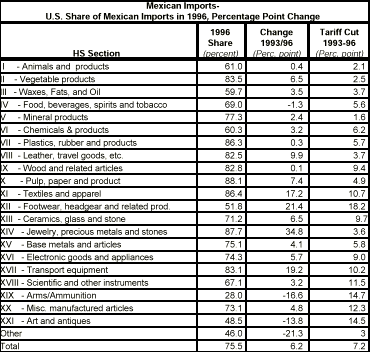
Turning again to the 22 sector breakdown of all U.S. exports to Mexico, Figure 4 shows clearly that U.S. exports hold a dominant position in the Mexican import market, and that U.S. exports have maintained or enhanced that dominance since
the NAFTA was implemented. In 1996, the U.S. share of Mexican imports exceeded 75 percent in 10 sectors, compared to just three sectors in 1993. The four largest U.S. sectoral shares were in paper/paperboard (88.1 percent), jewelry, precious metal stones (87.7 percent), textiles and apparel (86.4 percent) and plastics,
rubber and products (86.3 percent). Aside from art and antiques, arms and ammunition, and a residual "other" category, there was no sector of Mexican imports in 1996 in which U.S. exports enjoyed less than a 50 percent market share.
Between 1993 and 1996, the overall U.S. share of Mexico's import market rose by 6.2 percentage points. Sector-by-sector, the size of these market share gains was positively correlated to the size of the corresponding reductions in Mexican tariffs (excluding arms and ammunition, art and antiques, and the residual "other"
category). The largest gains for U.S. exports occurred in jewelry, precious metal stones (import market share up 34.8 percentage points), footwear and headgear (up 21.4 percentage points), transportation equipment (up 19.2 percentage points), and textiles and apparel (up 17.2 percentage points).
Thus, for example, the 17.2 percent point gain in Mexico's textiles and apparel import
market, which brought the U.S. share of that market to 86.4 percent, followed a 10.7 percentage point reduction in Mexico's average tariff on such items under NAFTA. Similarly, the 19.2 percentage point gain for U.S. exports in Mexico's transportation equipment market, which brought the U.S. share to 83.1 percent in 1996, followed a 10.2 percentage point drop in Mexican tariffs under NAFTA. In the electronics goods and appliances sector, the U.S. share of Mexico's import market grew by 5.7 percentage points to 74.3 percent in 1996, as the Mexican average tariff on such imports from the United States fell by 9.0 percentage points under NAFTA. (Table 2.)
Mexican Exports to the United States
Mexican exports to the United States increased over the period in all 12 sectors examined later in this Chapter, for the most part continuing trends established prior to the inception of the NAFTA. These increases reflected heightened U.S. demand for goods from all sources, domestic and foreign, stimulated by a strong and growing
U.S. economy during the period. As U.S. production levels were at or near full capacity during the period, these imports helped to satisfy increased U.S.
demand.
Mexico's Share of U.S. Import Market
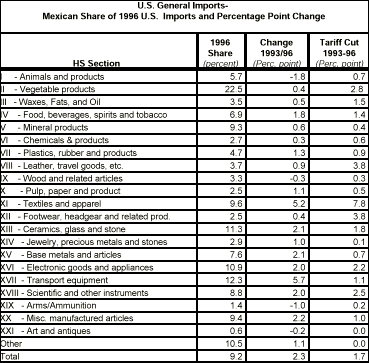
Mexico increased its share of the U.S. import market over the period in most of the 22 broad U.S. import sectors, though significantly less than U.S. exports increased their share of Mexico's import market. The largest recorded share increases for Mexico in the U.S. import market between 1993 and 1996 were in transportation
equipment (up 5.7 percentage points), textiles and apparel (5.2 percentage points) and
miscellaneous manufactured goods (2.2 percentage points). Statistically, increases of Mexican share the U.S. import market showed less correlation with U.S. tariff changes (correlation coefficient of 12.6) than was the case for U.S. shares of the Mexican import market (excluding arms and ammunition, art and antiques and the residual "other" category).
As noted earlier, Mexico's increased share of the U.S. import market is not a reliable
indicator of NAFTA's effects because it does not distinguish the effect of Mexico's peso devaluation -- which made Mexican products cheaper by comparison to other imports. Indeed, it is highly likely that the peso devaluation was a more significant reason for Mexico's increased market share than NAFTA because its effect on the price of Mexican imports in the United States was so much larger than that
of the average U.S. tariff changes due to NAFTA.
U.S. tariff reductions pursuant to NAFTA also appear to have had relatively little impact on Mexican imports in most sectors, as most reductions were very low.
39
Indeed, in several sectors Mexican exports to the United States enjoyed nearly complete duty-free access to the United States market prior to NAFTA under the GSP that provides duty-free treatment to specific products of selected developing countries. Moreover, special pre-existing U.S. customs provisions also provided for
reduced duties on Mexican products incorporating U.S. materials or components. In all, about 50 percent of Mexican imports entered the United States duty free prior to NAFTA.
While Mexico's share of U.S. imports across many sectors increased, those increases did not typically displace U.S. production, which was robust across sectors. For example, in two sectors in which Mexico's market share expanded most significantly, auto parts and textiles and apparel, the gains were a reflection of competitive advantages accruing to U.S. and Mexican producers as a result of
co-production arrangements. Those arrangements were enhanced by NAFTA and resulted in Mexican imports with relatively high U.S. content displacing imports from third countries, particularly in Asia. In the textile and apparel sector, Mexican imports increased their share of the U.S. import market from 4.4 percent in 1993 to 9.6 percent in 1996. By contrast, the top four suppliers to the United States in 1993 -- China, Hong Kong, Taiwan, and Korea -- lost a combined 9 percentage points of the U.S. import market.
A further indication that Mexican imports did not displace U.S. production is that U.S. production during the period was quite strong and growing. U.S. real industrial production from 1993 to 1996 increased by 11.4 percent. The pattern of strong growth in real U.S. output was visible, for example, across the sectors discussed in
more detail later in this Chapter. From 1993 to 1995 (latest data available), U.S. output in constant 1992 dollars was up: 2.4 percent for apparel; 3.6 percent for
textiles; 4.1 percent for processed foods; 4.9 percent for printed matter; 6.7 percent for
chemicals; 7.1 percent for recreational equipment; 7.8 percent for household appliances; 17.1 percent for automotive products; 35.5 percent for telecommunications equipment; 53.6 percent for electrical components; and 80.5 percent for computers.
Production Synergies in North America
The removal of trade barriers and expansion of trade in North America is particularly significant in light of the geographic proximity of the three countries. The long history of low barriers to U.S.-Canadian trade has contributed importantly to coordinated production on both sides of the border, which has created job and economic
opportunities, raised living standards in both Canada and the United States, and helped strengthen the competitiveness of producers in both countries. For instance,
open borders have long sustained joint automotive production, which has benefitted workers, companies, and consumers on both sides of the U.S.-Canadian border. In part, because of this market-driven coordination of production across the U.S.-Canadian border, U.S. imports from Canada tend to have a relatively high degree of U.S. content. The reduction of Mexico's tariff and other barriers to U.S. exports under NAFTA has already shown signs of encouraging market-driven
coordination of production across the U.S.-Mexican border. This is true in the auto sector, in the telecommunications equipment sector, in computers, in electronic
products, and in textiles and apparel, for example. Mexico tends to compete with other low and middle-income countries for labor-intensive, basic production which is complementary with the capital-intensive, highly-skilled production in the United States. For example, in the textiles and apparel sector, the NAFTA appears to be contributing to strong growth in two-way textiles and apparel trade with Mexico. In
apparel assembly, Mexico is displacing other leading producers, including China. Mexican assemblers use a much higher percentage of U.S. fabric and components,
than other assemblers thereby increasing U.S. exports and increasing the overall level of U.S.-produced content in U.S. apparel imports.
This type of market synergy increases the amount of U.S. content in the final goods sold in the U.S. market, as high value-added U.S. components and U.S. engineering, marketing, and financial services are incorporated. Again, this is
apparent in the textile and apparel sector, in which the percentage of Mexican exports by value to the United States incorporating U.S. components rose from 52 to 64 between 1993 and 1996. In many cases, the flexibility permitted by two-country manufacturing operations has made North America the lowest-cost producer of parts or final goods.
U.S. Employment, Wages and Productivity
U.S. employment rose by nearly 8.6 million jobs between December 1993 and December 1996. Manufacturing employment in the United States also rose by 156,000. 40
The U.S. civilian unemployment rate dropped from 6.9 percent in 1993 to 5.4 percent for 1996 (and dropped further to 5.0 percent early in 1997). U.S. employment levels in eleven of the twelve sectors examined later in this Chapter either rose or remained steady over the period. 41
There was no discernable relationship between U.S. employment levels and U.S.-Mexican trade balances at the sectoral level over the period. For example, in some sectors experiencing large net import flows, such as the automotive sector, U.S. employment levels grew significantly. 42
In its recent study, the ITC found that the NAFTA had no discernible effects on aggregate employment. Using a qualitative sectoral analysis, the ITC found that U.S. imports and exports attributable to the NAFTA had a negligible impact on U.S. employment in 66 of the 68 sectors that it examined. The ITC found that
imports generated by the NAFTA were partly responsible, in combination with other factors, for declines in employment in the apparel and women's non-athletic
footwear sectors.
43
It is worth observing that imports from Mexico in these two sectors appear to
have largely displaced imports from other countries.
44
Moreover, Mexican-made apparel and footwear exported to the United States have higher U.S. content, on average, than imports of these products from Asian and other countries.
In its qualitative analysis, the ITC also found that in 67 of 68 sectors, the NAFTA had a
negligible effect on U.S. wage levels. In one sector -- apparel -- the ITC concluded that imports attributable to the NAFTA shifted the composition of employment to higher-wage fabric cutting jobs. Overall, wages increased by 12 percent in the U.S. apparel sector from 1993 to 1996.
In its quantitative analysis, the ITC examined 120 sectors, and considered if changes in the price of Mexican imports -- whether attributable to the NAFTA or not -- had affected U.S. employment or hourly earnings. (The ITC did not analyze whether exports generated by the NAFTA may have raised U.S. earning or employment
levels.) In 20 of these industries, the ITC reported some change in earnings and employment levels. The ITC was unable to say whether any of these changes were
attributable to NAFTA.
Because of a lack of data, the ITC was not able to conduct a quantitative assessment of productivity changes, if any, attributable to the NAFTA. Nevertheless, in its qualitative analysis, the ITC reported productivity had increased in all
sectors (between 3 percent and 10 percent from 1993 to 1995) where it found the NAFTA to have generated significant changes in exports or imports.
Examination of Selected Sectors
Set out below is a detailed discussion of U.S.-Mexico trade and investment in 11 industrial sectors, and the agricultural commodities sector. The industrial sectors are: automotive vehicles and parts; chemicals and allied products; computers and software; four consumer products sectors, namely, furniture, household appliances,
printed products, and recreational equipment; electronic components; processed foods; telecommunications equipment; and textiles and apparel.
The sectors:
Summary of Findings
U.S.-Mexico trade and investment patterns in the 12 product sectors reveal that:
Footnotes:
31. Because NAFTA largely carried forward the provisions of the CFTA for U.S.-Canada trade, including its 31 ten-year tariff phase-out schedule (initiated in 1989), and made relatively few changes in either country's investment practices, this Chapter concentrates on U.S.-Mexico trade and investment effects.
32. The statistical information relied on in this Chapter is drawn from numerous sources, including the Bureau 32 of Census, the Customs Service, the Bureau of Labor Statistics, the Department of Agriculture, the Mexican Ministry of
Finance, and Statistics Canada.
33. Mexico was forced to devalue the peso as a result of its balance-of-payments crisis in December 1994. See discussion in Chapter 1.
34. These sectors are based on broad trade categories used in the U.S. Harmonized Tariff Schedule. They account for all goods trade with Mexico. A specific sectoral analysis is provided later in this Chapter for 12 sectors.
Comparative differences in U.S. and Mexico tariff reductions for the 22 sectors during 1993-96 are based on constructed values using 1992 tariffs, 1993 trade flows, and staged tariff reductions under the NAFTA.
35. These tariff reduction comparisons underestimate the true differential in tariff changes between the United States and Mexico since 1993 because they do not account for the tariff levels that would have prevailed in the United States and Mexico as a result of the Uruguay Round and in the absence of NAFTA. As a result of the
Uruguay Round, in 1995 the United States began a phased 35 percent reduction in the tariff rates it applies to imports from most non-NAFTA countries, to be completed by the year 2000. Mexico also will reduce its tariffs during this period, but will do
so from much higher average tariff rates than prevailed in 1993.
36. By contrast, U.S. exports to Canada grew in all but one of the 11 sectors during 1995.
37. For example, U.S. exports of automotive products rose by 44 percent over the first quarter of 1997 compared to the first quarter of 1993, exports of recreational equipment rose by 63 percent, chemicals by 71 percent, computers by 96 percent, textile and apparel exports by 107 percent, and exports of electronic
components rose by 210 percent.
38. With the possible exception of strong growth in the U.S. economy. See "Production Synergies in North America" below.
39. An exception was the textiles and apparel sector, for which average U.S. tariff rates for Mexican imports were 7.8 percentage points lower in 1996 than they were in 1993. By contrast, average 1993 tariff levels for chemical imports from Mexico, for example, fell by only 0.6 percentage points over the same period. Moreover, U.S. tariff rates would have fallen from 1993 levels by operation of U.S. commitments under the Uruguay Round Agreements even if the NAFTA had not taken effect.
40. Because of greater productivity growth in the U.S. manufacturing sector relative to the rest of the U.S. economy, strong growth in manufacturing output did not translate into large increases in manufacturing jobs, although manufacturing jobs increased slightly during the NAFTA period. Manufacturing output growth,
however, contributed to strong U.S. job growth in non-manufacturing sectors, due to demand generated by the manufacturing sector for inputs from other sectors of the U.S. economy, such as business services.
41. Employment levels fell in the U.S. textiles and apparel industry, consistent with a three-decade trend.
42. U.S. employment in the automotive industry grew by 14 percent from 1993 to 1996, including a 10.6 percent increase in employment in the automobile assembly sector. By contrast, Mexican employment in the automotive sector dropped steadily. During the period, U.S. imports of Mexican automotive vehicles and parts
rose by $11.75 billion to a total of $22.9 billion. U.S. exports to Mexico of automotive vehicles and parts were $8.4 billion in 1996, up from $7.5 billion in 1993. In the
computer equipment sector, where Mexican imports rose by $2 billion to a total of
$2.9 billion to 1996, U.S. employment rose 9 percent. U.S. computer exports to Mexico in 1996 were $1.9 billion, up by $0.7 billion from 1993.
43. The ITC reached this conclusion for women's non-athletic footwear despite the fact that it found it difficult to measure the impact of the NAFTA on employment in the sector because Mexico accounts for a small share of U.S. imports (2 percent in 1996) and because a major portion of the increased imports from Mexico from
1993 to 1996 in this sector had occurred in cross-border production operations. The ITC also found that the decline in employment in this sector was attributable in
part to higher productivity (up 10 percent from 1993 to 1995) as a result of extensive
U.S.-industry restructuring. Imports dominate this sector with 86 percent of the total U.S.market in 1996, up from 79 percent in 1993. Mexico's share of the total U.S. market increased by 1 percentage point during this time period, from 0.9 percent to 1.9 percent.
44. For apparel, the ITC reported that the growth in U.S. imports from Mexico was largely at the expense of traditional Asian suppliers. The ITC also noted that the combined share of the U.S. apparel import market for Hong Kong, Korea, Taiwan, and China declined from 44 percent in 1993 to 34 percent in 1996, while Mexico's share rose from 7 percent to 11 percent. Between 85 to 90 percent of the total value of U.S. imports from Mexico in this sector was generated by imports produced
through cross-border production operations (i.e., U.S.-made formed and cut fabric
assembled into apparel in Mexico). Over 70 percent of these imports incorporated U.S. content, a far larger percentage than from most producers outside North America.
45. Some sectors accounting for relatively significant one-way or two-way U.S.-Mexico trade, such as the mineral products sector, accounting for 6.7 percent of U.S.-Mexico trade in 1996, were not included in this section of the study because average tariff cuts by both countries during the period for the products covered
by the sector were very small. For example, Mexico and the United States cut their average tariffs on mineral product imports by approximately 1.6 and 0.5 percentage points from 1993 to 1996. The trade effects of tariff reductions such as these were undoubtedly minimal.
Continue on to The Automotive Industry
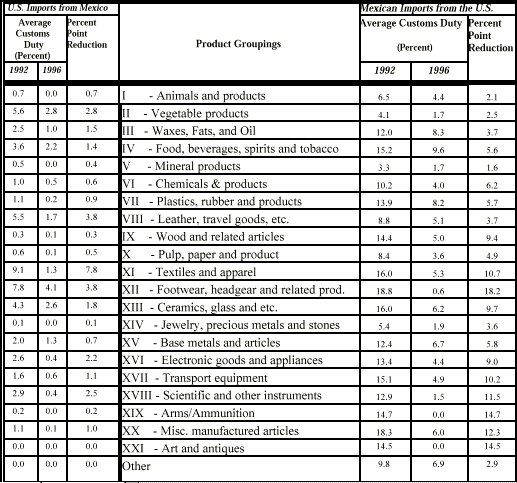
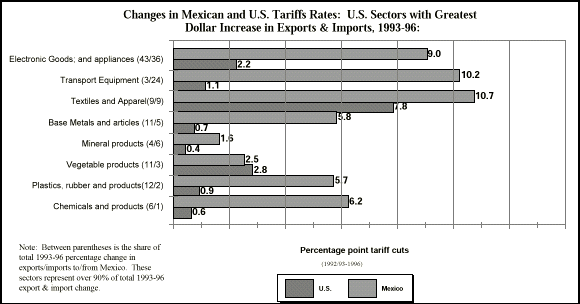
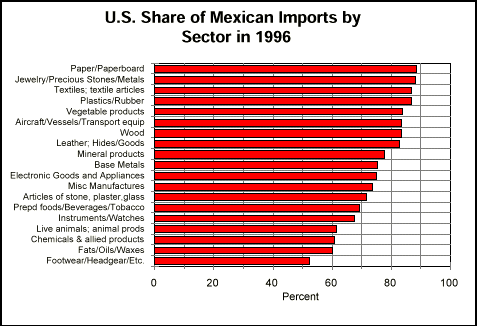
Figure 4
